Research
Paid Advertising Statistics 2026: UK and Platform Benchmarks
The UK and platform paid advertising figures for 2026, each hyperlinked to its source with the date it was read and the currency stated.
Key figures
- UK digital advertising spend, 2025
- £40.5bn
- UK total advertising investment, Q1 2026
- £11.7bn
- Google advertising revenue, quarter ended 30 June 2026
- $81.63bn USD
- Average search cost per click, all industries, 2026
- $5.42 USD
- Non-brand CPA, low-CPC against high-CPC keywords
- $181.91 against $99.90 USD
Most paid advertising statistics pages are a heap of numbers with a brand name in brackets after them, and half of those numbers turn out to be an aggregator quoting an aggregator. This page is for the person who needs one figure they can attribute and then get on with their day: everything below is hyperlinked to the page it came from, carries the date we read it and the currency it was reported in, and every derived figure shows its arithmetic. Where a figure could not be re-read at its primary source on the day, it is not here.
What the UK spends on advertising
Total UK advertising investment rose 9.3% year on year in the first quarter of 2026, to £11.7bn, according to the AA/WARC Expenditure Report executive summary for Q1 2026 (pounds sterling, read 18 September 2026). WARC notes the quarter came in 1.7 percentage points ahead of its own April forecast, which is worth carrying whenever you quote it: this is a measured quarter beating a forecast, not a forecast.
Two things about the method matter if you are going to cite it. The Advertising Association and WARC survey all media types quarterly, and the revenue figures are collected before the deduction of agency commission but after all negotiated discounts, with production costs excluded apart from direct mail. The report is also quarterly, so the “latest” number moves: the same WARC page schedules the Q2 2026 edition for October 2026.
You will notice there is no full-year 2025 UK total on this page. That is deliberate. The series was restated during 2026 under new channel definitions, several different 2025 totals are now circulating in secondary coverage, and we could not read a primary for any of them today. A figure that cannot be re-sourced is dropped, not carried.
What the UK spends on digital advertising
The UK digital advertising market reached £40.5bn in 2025, up 10% year on year, with video investment up 20% to £9.3bn, according to IAB UK’s Digital Adspend page (pounds sterling, full-year 2025 edition, read 18 September 2026). IAB UK describes Adspend as the official measure of the size of the UK digital advertising market, a census of UK media owners and intermediaries covering desktop, tablet and mobile, and says it has been the figure used by the Advertising Association since 1997.
Name the edition when you quote this, because the edition is where the drift comes from. IAB UK’s own page says the full-year 2025 report includes analysis of an updated methodology underpinning this year’s results. A digital adspend number from an earlier edition is therefore not a like-for-like comparison with the £40.5bn above, however confidently a blog post sets the two side by side.
What the platforms reported
Every figure in this section is a company’s disclosure about its own business, published in a results release. That makes it about as reliable as a number gets, and it still means the company chose what to report.
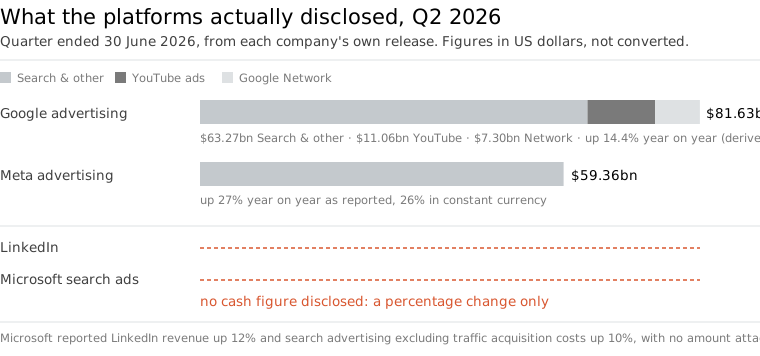
Google advertising revenue was $81,629m in the quarter ended 30 June 2026, against $71,340m in the same quarter of 2025, per Alphabet’s second quarter 2026 results (US dollars, released 22 July 2026, read 18 September 2026). Inside that: Google Search and other at $63,271m, up 17%, YouTube ads at $11,055m, up 13%, and Google Network at $7,303m, down from $7,354m a year earlier.
Google advertising as a whole grew 14.4% year on year, and that figure is derived, because Alphabet publishes percentage growth for the components but not for the combined advertising line. The working: ($81,629m minus $71,340m) divided by $71,340m equals 14.4%, both inputs taken from the supplemental table in the same release, as of 22 July 2026.
Meta
Meta’s advertising revenue was $59,363m in the quarter ended 30 June 2026, up 27% year on year as reported and 26% in constant currency, per Meta’s second quarter 2026 results (US dollars, released 29 July 2026, read 18 September 2026). Ad impressions delivered across the Family of Apps rose 14% and the average price per ad rose 12%, both year on year, in the same release.
Family daily active people averaged 3.60 billion for June 2026, up 3%, per that release. That is a family metric covering Facebook, Instagram, WhatsApp and Messenger together, and it is not a Facebook user count, whatever a hundred roundups say. From those two disclosures we can derive advertising revenue of $16.49 per daily active person for the quarter: $59,363m divided by 3,600m equals $16.49, as of 29 July 2026. Treat it as an order of magnitude rather than a precise unit economic, because the revenue covers three months and the audience figure is a June average.
LinkedIn and Microsoft search
Microsoft’s FY26 Q4 earnings release (quarter ended 30 June 2026, released 29 July 2026, read 18 September 2026) reports that LinkedIn revenue increased 12%, up 10% in constant currency, and that search advertising revenue excluding traffic acquisition costs increased 10%, up 9% in constant currency. No cash amount is attached to either, and LinkedIn advertising is not broken out from the rest of LinkedIn at all.
So if you have seen a confident pound or dollar figure for LinkedIn advertising revenue, it is somebody’s estimate rather than a disclosure, and it should be attributed to whoever estimated it.
What a search click costs
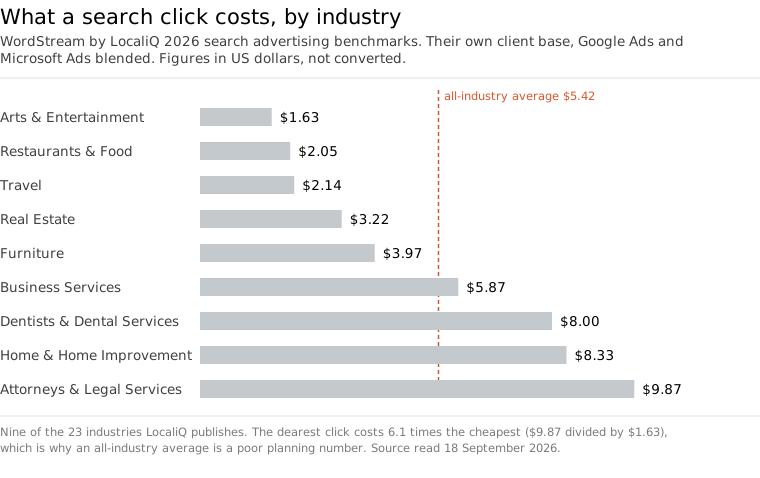
The average cost per click for search advertising across all industries in 2026 is $5.42, with an average click-through rate of 6.64%, an average conversion rate of 8.18% and an average cost per lead of $66.69, according to the 2026 search advertising benchmarks from WordStream by LocaliQ (US dollars, page last updated 1 June 2026, read 18 September 2026).
Label this one properly, because it is the most re-quoted set of numbers in the category and it is a vendor’s claim about its own customers. WordStream and LocaliQ are one company publishing one dataset, so they are never two sources for the same figure. The page describes its sample as thousands of its customers’ campaigns across Google Ads and Microsoft Ads; it does not state a sample size or a date range on the page itself, and LocaliQ is a US business, so read these as US-weighted client-base averages rather than UK ones.
The industry rows are more use than the headline. In the same table, Furniture sits at a $3.97 average cost per click, a 2.99% conversion rate and a $106.70 cost per lead, while Business Services sits at $5.87, 4.85% and $93.69. One derived figure worth having: the dearest industry click costs 6.1 times the cheapest, being $9.87 for Attorneys and Legal Services divided by $1.63 for Arts and Entertainment, both read there on 18 September 2026.
Why these rates do not compare across platforms
A league table of conversion rates by platform is the most common mistake in this category, and it is worth saying plainly why it does not work. A conversion rate in Alphabet’s ecosystem is click to conversion inside Google’s own attribution model, while a Meta conversion rate depends on the attribution window the advertiser has set, and Meta does not report a cost per click at all: it reports impressions and average price per ad. The same care applies to percentages generally, since a move from two per cent to three per cent is one percentage point and also a fifty per cent increase, and the two are not interchangeable in a sentence.
One internal cross-check shows how loosely even a single dataset holds together. Dividing the LocaliQ average cost per click by its average conversion rate gives an implied cost per lead of $66.26 ($5.42 divided by 8.18%), against the $66.69 the same page publishes, a gap of about 0.6%. That is derived arithmetic rather than a finding, read on 18 September 2026, and the difference is simply because each average is computed independently. Benchmark averages are directional, and quoting them to the penny implies a precision they do not have.
What we find in our own accounts
Our own first-party finding runs against the instinct that a cheaper click buys a cheaper customer. Across eight B2B accounts and about $2.67m of Google Search spend over two years, non-brand cost per acquisition was $181.91 on low-CPC keywords against $99.90 on high-CPC keywords, 45% lower on the expensive clicks (US dollars). On brand terms the pattern inverts: $25.76 against $147.09, 471% higher. The method and the full working are in Stop Chasing Cheap Clicks, read 18 September 2026.
This is Snowball Creations client data rather than an industry benchmark, and it describes B2B Google Search accounts, so do not stretch it to e-commerce or to other channels. It is here because it is the one number on this page nobody else publishes.
Method
Every figure on this page was read at its primary source on 18 September 2026, not carried over from a previous version and not taken from memory. Anything that could not be re-read on the day was dropped, which is why the full-year 2025 UK advertising total is absent.
Three figures are derived, and each shows its inputs and arithmetic where it appears: Google advertising growth of 14.4% from Alphabet’s release, advertising revenue of $16.49 per daily active person from Meta’s, and the spread between the dearest and cheapest industry click from LocaliQ’s table. The implied cost per lead is a cross-check rather than a finding. None of these are measured figures and none should be re-quoted as though they were.
Four sources here are a party’s claim about itself, and are labelled as such in the text: the Alphabet, Meta and Microsoft results releases, and the WordStream by LocaliQ benchmarks, which describe that company’s own client base. Meta’s daily active people is a family metric across Facebook, Instagram, WhatsApp and Messenger. Currencies are left as reported, pounds for the UK sources and US dollars for the platforms and the benchmarks, with no conversion anywhere on this page.
This is the hub page for our research library. Platform pages for PPC, Google Ads and social advertising are being built out from here, and each will link back to this one.
What this means if you are running ads
If you are planning a budget from the benchmark averages, the industry row is the number to use and the all-industry average is the one to ignore, because the spread between industries makes the blended figure a poor proxy for anything. And if your reporting compares a Google conversion rate with a Meta one in the same table, that comparison is doing less work than it appears to.
We run paid advertising for B2B and SaaS businesses at /saas-paid-ads-agency/ and for homeware and furniture brands at /homeware-paid-ads-agency/. If you want someone to look at your account against these numbers, get in touch.
FAQ
Questions people ask
Why are the platform figures in dollars and the UK figures in pounds?
Because that is how each source reported them. Alphabet, Meta and Microsoft report in US dollars, the IAB and AA/WARC in pounds sterling. Converting one into the other needs a dated exchange rate and quietly turns a measured figure into a derived one, so we leave each in its own currency and say which.
Can I quote these numbers in my own article?
Yes. Quote the figure, the source we have linked and the date beside it, and go to that source rather than to us where you can. If a figure here is derived, it says so and shows the arithmetic, and a derived figure should never be re-quoted as a measured one.
How often is this page updated?
Every figure is re-read at its primary source when the page is refreshed, and the updated date at the top is the date of that read. The page is rolled each January and the URL never changes, so a link to it does not rot when the year does.
Why is there no full-year 2025 total for UK advertising here?
Because we could not read one at its primary source on the day we wrote this. AA/WARC restated the series during 2026 under new channel definitions, so several different totals for 2025 are circulating in secondary coverage. A figure we cannot re-source is dropped rather than carried.
Sources
- 1. IAB UK Digital Adspend, full-year 2025 edition Read 2026-09-18
- 2. Advertising Association and WARC Expenditure Report, executive summary Q1 2026 Read 2026-09-18
- 3. Alphabet, second quarter 2026 results Read 2026-09-18
- 4. Meta Platforms, second quarter 2026 results Read 2026-09-18
- 5. Microsoft, FY26 Q4 earnings release Read 2026-09-18
- 6. WordStream by LocaliQ, 2026 search advertising benchmarks Read 2026-09-18
- 7. Snowball Creations, Stop Chasing Cheap Clicks Read 2026-09-18
Cite this page
Free to quote with a link back. Figures were last checked on 18 September 2026.
Snowball Creations, "Paid Advertising Statistics 2026: UK and Platform Benchmarks", 2026. https://snowballcreations.com/research/paid-advertising-statistics/
A plain-text version for AI tools and reference managers: /research/paid-advertising-statistics.md