Research
PPC Statistics 2026: Key Benchmarks Across Platforms
Current PPC benchmarks for search, Meta and Amazon, every figure hyperlinked to its source with the date it was read.
Key figures
- Average search cost per click, all industries, 2026 edition
- $5.42 USD
- Average search cost per lead, all industries, 2026 edition
- $66.69 USD
- UK search ad spend, full year 2025
- £17.9bn
- Google advertising revenue, quarter ended 30 June 2026
- $81.6bn USD
- Non-brand CPA, low-CPC against high-CPC keywords (8 B2B accounts)
- $181.91 against $99.90 USD
Every figure below was read off its own source on 25 September 2026, and every one carries a link to that source in the same paragraph. If you are writing something that needs a PPC number, take it from here and credit the primary underneath.
The 2026 search benchmarks, and whose numbers they are
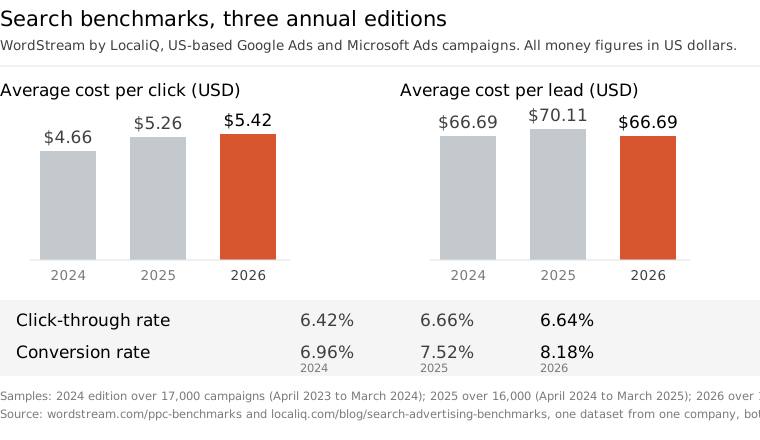
Across industries, the 2026 averages for search advertising are a cost per click of $5.42 USD, a click-through rate of 6.64%, a conversion rate of 8.18% and a cost per lead of $66.69 USD, published by WordStream by LocaliQ, last updated 1 June 2026 and read on 25 September 2026.
Whose campaigns are they? The WordStream benchmarks index, read 25 September 2026, says the 2026 edition covers over 13,000 US-based campaigns running from April 2025 through March 2026. WordStream and LocaliQ are one company publishing one dataset, so a roundup citing both is citing one source twice. The campaigns are that company’s own customers and they mix Google Ads with Microsoft Ads, which makes this a starting line rather than a verdict on your account.
The spread is worth more than the average. On the same page, read 25 September 2026, cost per click runs from $1.63 USD in Arts and Entertainment to $9.87 USD in Attorneys and Legal Services, while furniture advertisers pay $3.97 USD a click and $106.70 USD a lead, and business services pay $5.87 USD a click and $93.69 USD a lead. A cheap click and a cheap lead are not the same purchase.
What these averages do not tell you
Cost per lead is not an independent measurement, it is the other two divided. Take the published figures on the benchmarks page, read 25 September 2026, and $5.42 USD divided by 8.18% gives an implied cost per lead of $66.26 USD, which is 43 cents under the $66.69 USD published beside it. That gap is not an error in either number: each average is taken across a slightly different set of campaigns. The implied figure is ours, derived on 25 September 2026, and it is not a measurement.
A second caution is ours rather than the source’s. Conversion rates are not comparable between platforms: Google reports click to conversion inside its own attribution, Meta’s depends on the attribution window you have set, and a conversion is a form fill in one account and a booked call in another. Any table that lines those up as a league table is selling you tidiness.
All the money above is in US dollars and none of it is converted here. The campaigns are US-based, your auction is not, and a silent conversion would only hide that.
What UK advertisers actually spent on search
UK digital ad spend reached £40.5bn in 2025, up 10%, and search took 44% of it at £17.9bn, up 6% year on year, according to IAB UK’s Digital Adspend 2025, published 3 March 2026 and read 25 September 2026. Social was £11.5bn (28% of the market), video £9.3bn (23%) and retail media £3.8bn, up 18%.
Two things to carry with those figures. The categories overlap, because the same release counts video across social platforms, broadcasters, streamers and publishers, so you cannot add them up. And IAB UK now runs the study with Oliver Wyman on an updated methodology, restating 2024 and stating plainly that the new data cannot be reconciled with editions released before it. The same release forecasts £44.7bn for 2026, growth of 10.3%.
What the platforms charged in one quarter
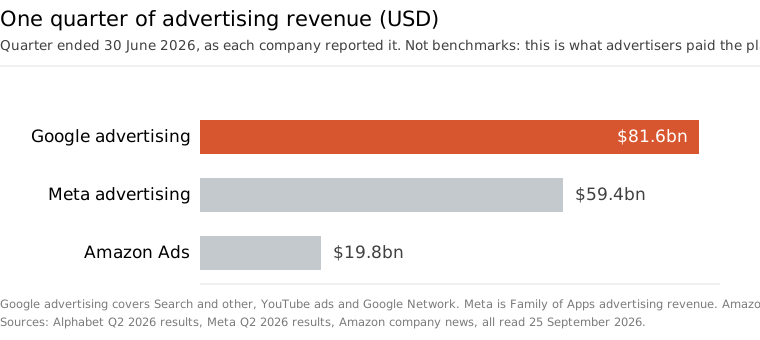
Google advertising revenue was $81,629m USD for the quarter ended 30 June 2026, made up of Google Search and other at $63,271m, YouTube ads at $11,055m and Google Network at $7,303m, per Alphabet’s second quarter 2026 results, dated 22 July 2026 and read 25 September 2026. Search and other grew 17% year on year.
Search is 77.5% of everything Google earns from advertising. That one is derived: $63,271m divided by $81,629m is 0.7751, worked out by us on 25 September 2026 from the supplemental table in that same release. Alphabet does not publish the share itself.
Meta’s Family of Apps advertising revenue was $59,363m USD, up 27%, with ad impressions up 14% and average price per ad up 12% year on year, per Meta’s second quarter 2026 results, dated 29 July 2026 and read 25 September 2026. Family daily active people averaged 3.60 billion in June 2026, and that is a family number across Facebook, Instagram, WhatsApp and Messenger, never a Facebook audience.
Those two advertiser-facing numbers almost explain the revenue on their own: 1.14 multiplied by 1.12 is 1.2768, an implied 27.7% increase against the 27% Meta reported, derived by us on 25 September 2026 from the same release. More impressions at a higher price is the whole story of a Meta budget this year.
Amazon says Amazon Ads generated $19.8 billion USD in Q2 2026, up 26% year on year, on its own company news page, published 31 July 2026 and read 25 September 2026. That is Amazon’s own rounded statement about its own revenue, and the performance claims on the same page, such as shoppers clicking a Sponsored Prompt converting 48% more often, are Amazon’s marketing rather than independent measurement.
There is no LinkedIn figure here. LinkedIn’s advertising sits inside Microsoft’s segment reporting and we could not read a cash figure off a filing on the day this page was updated, so it is left out rather than borrowed from someone’s summary.
What a cheap click actually costs
Our own research looked at eight B2B accounts and about $2.67m of Google Search spend over two years. Non-brand cost per acquisition was $181.91 on low-CPC keywords against $99.90 on high-CPC keywords (45% lower), and brand CPA was $25.76 against $147.09 (471% higher). The method and the tables are in Stop Chasing Cheap Clicks, Snowball Creations first-party data, eight accounts, two years, figures in US dollars.
That is the practical reason the benchmark table above is a starting line and not a target. In those accounts the cheapest clicks produced the dearest non-brand acquisitions, so an account optimised towards the average cost per click would have been optimised away from the money.
Method
Every figure on this page was read off its own source on 25 September 2026 and linked in the paragraph it appears in. Three are derived and each shows its working where it sits: the implied cost per lead from the WordStream by LocaliQ benchmarks, the Search share of Google advertising from Alphabet’s second quarter results, and the implied revenue increase from Meta’s second quarter results. Nothing was carried over from the 2025 version of this page: most of the statistics it listed traced back to aggregators rather than to a primary source, and anything that could not be re-sourced today was dropped rather than refreshed.
Claims are labelled as claims. WordStream and LocaliQ are one company and one dataset. Meta’s daily active people is a family metric. Amazon’s advertising revenue is Amazon’s own statement about itself. Money is quoted in the currency its source used, so dollars stay dollars and pounds stay pounds, with no conversion anywhere on the page.
This page is maintained: it is rolled every January and re-read whenever a source publishes a new edition. It replaces our 2025 PPC statistics post and sits under the hub, Paid Advertising Statistics 2026.
What this means if you are running ads
Benchmarks are for sizing an argument, not for running an account: the useful question is not whether your cost per click beats the average, it is whether the clicks you are buying turn into customers you can afford. If you would like someone to look at yours, we run paid ads for B2B and SaaS businesses, and you can get in touch.
FAQ
Questions people ask
Are these PPC benchmarks UK figures?
The cost benchmarks are not. They come from US-based campaigns in one company's client base. The UK figures on this page are the market-size ones from IAB UK, in pounds.
Why is there no LinkedIn cost figure here?
Because we could not read one off a primary source on the day this page was updated. A benchmark we cannot link is a benchmark we leave out.
Can I quote these numbers?
Yes, and please cite the primary source we link to rather than us, unless the figure is our own first-party research or one of the three derived figures, which are ours.
Sources
- 1. WordStream by LocaliQ, search advertising benchmarks 2026 Read 2026-09-25
- 2. WordStream by LocaliQ, PPC benchmarks index (samples and prior editions) Read 2026-09-25
- 3. IAB UK, Digital Adspend 2025 Read 2026-09-25
- 4. Alphabet, second quarter 2026 results Read 2026-09-25
- 5. Meta, second quarter 2026 results Read 2026-09-25
- 6. Amazon, Q2 earnings: what is driving Amazon Ads growth Read 2026-09-25
- 7. Snowball Creations, Stop Chasing Cheap Clicks (first-party, 8 B2B accounts) Read 2026-09-25
Cite this page
Free to quote with a link back. Figures were last checked on 25 September 2026.
Snowball Creations, "PPC Statistics 2026: Key Benchmarks Across Platforms", 2026. https://snowballcreations.com/research/ppc-statistics/
A plain-text version for AI tools and reference managers: /research/ppc-statistics.md