Research
Social Media Advertising Statistics 2026: Key Figures
UK social reach and spend, Meta's auction numbers and the 2026 Facebook benchmarks, every figure linked to its source with the date it was read.
Key figures
- UK social media ad spend, full year 2025
- £11.5bn (28% of UK digital)
- Meta average price per ad and ad impressions, change year on year, quarter ended 30 June 2026
- +12% price, +14% impressions
- Average Facebook cost per lead, leads campaigns, 2026 edition (US panel)
- $27.39 USD
- Share of UK online adults using TikTok, May 2025
- 56%
- YouTube ads revenue, quarter ended 30 June 2026
- $11,055m USD (+13%)
Every figure below was read off its own source on 24 October 2026 and is linked in the paragraph it sits in. This is the social page in our research set: the market-wide numbers live on the hub, Paid Advertising Statistics 2026, and the search ones on Google Ads Statistics 2026. If you need a social advertising number to attribute, take it from here and credit the primary underneath.
What UK adults actually use, measured rather than claimed
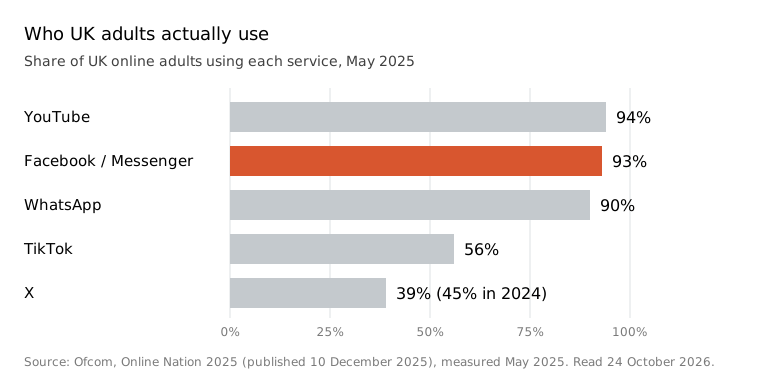
YouTube was used by 94% of UK adult internet users in May 2025, the combination of Facebook and Messenger by 93% of online adults, WhatsApp by 90% (up from 87% a year earlier), TikTok by 56% and X by 39% (down from 45%), according to Ofcom’s Online Nation 2025 report, published 10 December 2025 and read 24 October 2026. These are measured visitor figures, not the platforms’ own counts, which is why we lead with them.
The same Ofcom report says UK adults spent an average of 4 hours 30 minutes a day online on personal devices in May 2025, up 10 minutes on 2024, and that half (51%) of that time went to services owned by Alphabet or Meta. Alphabet reached 99% of UK online adults and Meta 97%. TikTok’s owner, ByteDance, ranked 17th with a reach of 56%, and TikTok users aged 18 to 34 spent 49 minutes a day on it.
Mind the dates. The report was published in December 2025 but measured May 2025, and Ofcom’s report page shows that as the latest edition when we read it. Quote the measurement month, not the publication date, and certainly not the year you happen to be writing in.
What UK advertisers spend on social
UK social media ad spend rose 21% to £11.5bn in 2025, 28% of a £40.5bn digital market, with video making up 59% of social investment, according to IAB UK and Oliver Wyman’s Digital Adspend 2025, posted 3 March 2026 and read 24 October 2026. Search was still larger at £17.9bn, but it grew 6% against social’s 21%.
Two cautions. The same release says IAB UK moved to an updated methodology from HY 2025 and that the new data cannot be reconciled with editions released before it, so do not set this figure against a social number from an older edition. And the newer HY 2026 release, published 29 September 2026, gives a £21.2bn total, search at £9.1bn and video at £5.1bn for the first half of 2026 but no social figure in its public text. The full-year 2025 number is the latest UK social figure we could read.
Meta’s auction: more ads, and dearer ones
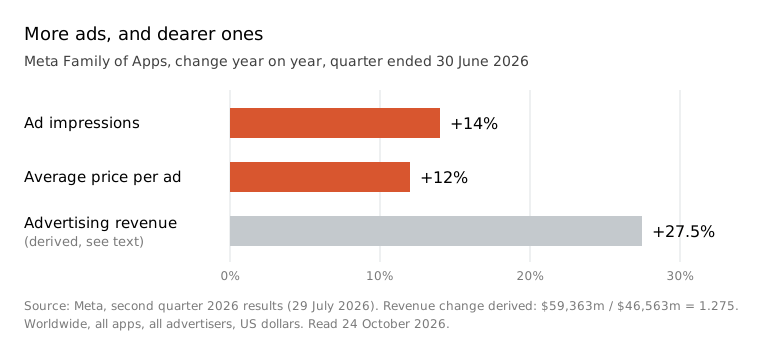
In the quarter ended 30 June 2026, ad impressions across Meta’s Family of Apps rose 14% year on year and the average price per ad rose 12%, according to Meta’s second quarter 2026 results, dated 29 July 2026 and read 24 October 2026. Those two lines are the closest thing Meta publishes to a price index. They are worldwide averages across every app and every advertiser, not the cost of your next campaign.
Advertising revenue was $59,363m USD in the quarter against $46,563m USD a year earlier, per the income table in the same release. Derived by us on 24 October 2026: $59,363m divided by $46,563m is 1.2749, a 27.5% increase. As a cross-check, 1.14 (impressions) multiplied by 1.12 (price per ad) is 1.2768, an implied 27.7%. The small gap is what you would expect from two inputs rounded to whole percentages. Both figures are our arithmetic, not Meta’s.
Also derived from that income table: advertising was 97.6% of Meta’s $60,801m USD total revenue ($59,363m divided by $60,801m is 0.9763). Meta does not state the share itself.
The audience figure to handle with care
Meta’s family daily active people was 3.60 billion on average for June 2026, up 3%, per the Q2 2026 release. That is a family metric: people active on at least one of Facebook, Instagram, WhatsApp or Messenger. It is not a Facebook number, and every page that calls it one is wrong in a way a careful reader will spot.
Facebook ad benchmarks, and whose campaigns they are
For traffic campaigns, the 2026 averages are a click-through rate of 1.93% (up from 1.71%) and a cost per click of $0.60 USD (down from $0.70). For leads campaigns they are a 2.70% click-through rate, a $1.80 USD cost per click, an 8.54% conversion rate and a $27.39 USD cost per lead (down from $27.66). All of that is from WordStream by LocaliQ’s Facebook advertising benchmarks, last updated 23 September 2026 and read 24 October 2026.
Know what sits behind them. WordStream’s own write-up, last updated 15 September 2026, describes the data as over 1,800 Facebook ad campaigns running over the last year, and the averages describe that company’s own customers. WordStream and LocaliQ are one company publishing one dataset, so a roundup citing both is citing one source twice. Every money figure is in US dollars and none is converted here.
The rows that matter for homeware and B2B
On the LocaliQ tables, read 24 October 2026, Furniture’s leads campaigns run at a 3.78% click-through rate, a $2.18 USD cost per click, a 5.66% conversion rate and a $39.25 USD cost per lead. Home and Home Improvement pays $42.95 USD a lead, and Business Services traffic campaigns pay $0.70 USD a click at a 1.64% click-through rate. Furniture sits near the top for click-through and well above average on cost per lead, which is the usual story: people love looking at sofas.
One reading note. On that page the commentary under the leads cost-per-click table describes the dearest industries as the cheapest and the cheapest as the dearest; the table itself is consistent, and the table is what we quote. Conversion rates also deserve care: Meta counts a conversion according to the attribution window the advertiser sets, so a Facebook conversion rate and a Google Ads one are not measuring the same thing.
YouTube: the social video line inside Google
YouTube ads revenue was $11,055m USD in the quarter ended 30 June 2026 against $9,796m USD a year earlier, and Alphabet puts the growth at 13%, per Alphabet’s second quarter 2026 results, dated 22 July 2026 and read 24 October 2026. That is a worldwide advertising figure only; Alphabet reports subscriptions on a separate line of the same table.
Put it beside the UK reach figure and the picture is consistent. YouTube was the most-used service in Ofcom’s report, at 94% of UK adult internet users and an average of 51 minutes a day in May 2025, not counting viewing on a TV set.
LinkedIn: growth rates, not a price list
LinkedIn revenue increased 12% (10% in constant currency) in the quarter ended 30 June 2026, according to Microsoft’s FY26 fourth quarter earnings release, dated 29 July 2026 and read 24 October 2026. That is LinkedIn’s total revenue across its lines of business, not advertising alone, and the quarterly release gives it only as a percentage.
So there is no LinkedIn advertising revenue figure on this page, and no member count either. LinkedIn’s headline member number counts registered accounts, not active users, and quoting it as an audience is the most common LinkedIn statistics mistake in circulation. Our own LinkedIn reference will carry the annual figures from Microsoft’s filings once it is written.
TikTok and Pinterest
For TikTok, the most useful UK number is the independent one: 56% of UK online adults visited it in May 2025, with users aged 18 to 34 averaging 49 minutes a day, per Ofcom’s Online Nation 2025, read 24 October 2026. We have used that rather than TikTok’s own audience claims, which are self-reported.
Pinterest reported revenue of $1,180m USD for the quarter ended 30 June 2026, up 18%, with 640 million monthly active users by its own count, in its second quarter 2026 results, dated 4 August 2026 and read 24 October 2026. Europe brought in $213m USD (up 12%) from 157 million monthly active users, at an average revenue per user of $1.35 USD against $8.30 USD in the US and Canada. Derived by us from that table: $213m divided by $1,180m is 0.1805, so Europe was 18.1% of Pinterest’s revenue.
Two notes. The release reports total revenue and does not label it advertising revenue, so pages quoting a Pinterest “ad revenue” figure have usually relabelled it. And we include Pinterest because homeware brands ask about it, not because we run it.
Method
Every figure on this page was read off its own source on 24 October 2026 and linked where it appears. Three are derived and show their working in place: Meta’s advertising revenue growth and its share of revenue from Meta’s Q2 2026 release, and Europe’s share of revenue from Pinterest’s Q2 2026 release. Nothing was carried over from the January 2026 version of this page; anything we could not trace to a primary today was dropped.
Claims are labelled as claims. Meta’s daily active people is a family metric. Pinterest’s user count is its own. WordStream and LocaliQ are one company and one dataset describing their own US customers. Ofcom’s figures are measured visitors in May 2025, and IAB UK’s spend figures come from its own methodology, which changed in 2025. Money stays in the currency its source used, with no conversion anywhere on the page.
This page is maintained: it is rolled every January and re-read when Meta, Alphabet, Microsoft or Pinterest file a new quarter, or when Ofcom or IAB UK publish a new edition. It replaces our January 2026 social media marketing statistics post and sits under the hub, Paid Advertising Statistics 2026.
What this means if you are running social ads
Meta is selling more ads at higher prices, which means the advertisers who do well are the ones whose creative and offer earn the click rather than the ones who simply spend more. If you would like someone to look at your account, we run Meta advertising for B2B, SaaS and homeware brands, and you can get in touch.
FAQ
Questions people ask
Why is there no Instagram user number on this page?
We could not read an Instagram-only UK figure off a primary source on the day we rebuilt the page. Rather than repeat a worldwide figure re-quoted by an aggregator, we left it out. It goes in when a primary publishes it.
Can I convert the dollar benchmarks on this page into pounds?
You can do the arithmetic, but it will not give you a UK benchmark. The Facebook averages come from US campaigns and the platform filings are worldwide, so a converted figure is a US or global number wearing a pound sign. We leave every figure in the currency its source used.
What happened to the statistics in the January 2026 version of this page?
Most were attributed in plain text to aggregators and statistics sites rather than to whoever measured them. Every figure was re-read for this rebuild, and anything we could not trace to its original publisher on the day was dropped rather than refreshed.
Sources
- 1. Ofcom, Online Nation 2025 report (published 10 December 2025, measured May 2025) Read 2026-10-24
- 2. Ofcom, Online Nation (report page and edition dates) Read 2026-10-24
- 3. IAB UK and Oliver Wyman, Digital Adspend 2025 Read 2026-10-24
- 4. IAB UK and mediasense, Digital Adspend HY 2026 Read 2026-10-24
- 5. Meta, second quarter 2026 results (Exhibit 99.1) Read 2026-10-24
- 6. WordStream by LocaliQ, Facebook advertising benchmarks 2026 Read 2026-10-24
- 7. WordStream, Facebook ads benchmarks 2026 (sample statement) Read 2026-10-24
- 8. Alphabet, second quarter 2026 results Read 2026-10-24
- 9. Microsoft, FY26 fourth quarter earnings release Read 2026-10-24
- 10. Pinterest, second quarter 2026 results (Exhibit 99.1) Read 2026-10-24
Cite this page
Free to quote with a link back. Figures were last checked on 24 October 2026.
Snowball Creations, "Social Media Advertising Statistics 2026: Key Figures", 2026. https://snowballcreations.com/research/social-media-advertising-statistics/
A plain-text version for AI tools and reference managers: /research/social-media-advertising-statistics.md