Research
LinkedIn Ads Statistics 2026: Revenue, Members, Benchmarks
LinkedIn revenue from Microsoft's filings, members with the registration caveat, Dreamdata's 2026 benchmarks and budget floors, every figure linked and dated.
Key figures
- LinkedIn revenue, Microsoft fiscal year ended 30 June 2026 (every LinkedIn business, not ads alone)
- $19,817m USD (+11%)
- LinkedIn members, by LinkedIn's and Microsoft's own count (registered accounts, not active users)
- 1.3bn+
- LinkedIn's share of B2B ad budgets, Dreamdata customer panel, 2026 report
- 41%
- LinkedIn return on ad spend, Dreamdata customer panel, 2025 data
- 121%
- LinkedIn minimum daily campaign budget
- $10 USD
Every figure below was read off its own source on 25 October 2026 and is linked in the paragraph it sits in. This is the LinkedIn page in our research set: the cross-platform numbers live on the hub, Paid Advertising Statistics 2026, and Meta and UK reach on Social Media Advertising Statistics 2026. LinkedIn is the platform where the numbers in circulation are least often sourced, so the useful part here is which ones are measured, which are claims, and which nobody publishes at all.
LinkedIn’s revenue, from Microsoft’s filings
LinkedIn revenue was $19,817m USD in Microsoft’s fiscal year ended 30 June 2026, against $17,812m USD in fiscal 2025 and $16,372m USD in fiscal 2024, per the revenue-by-product table in Microsoft’s 2026 annual report, which carries the fiscal 2026 Form 10-K and was read 25 October 2026. Microsoft describes the increase as $2.0 billion or 11%, “with growth across all lines of business”. That covers every LinkedIn business, Talent Solutions, Premium Subscriptions and Sales Solutions as well as Marketing Solutions, which is where the advertising sits.
Derived by us from that table on 25 October 2026: $19,817m minus $17,812m is $2,005m, and $19,817m divided by $17,812m is 1.1126, an 11.3% increase, which matches Microsoft’s rounded $2.0 billion and 11%. The year before grew more slowly: $17,812m divided by $16,372m is 1.0880, an 8.8% increase. Both percentages are our arithmetic on Microsoft’s figures, not numbers Microsoft printed.
LinkedIn’s own pressroom statistics page, read 25 October 2026, rounds the same year to $19.8B USD of annual revenue, so the two agree. If you see a LinkedIn revenue figure with no fiscal year beside it, ask which year it is: Microsoft’s runs July to June, so “LinkedIn revenue 2026” properly means the twelve months to June 2026, not the calendar year.
Quarter by quarter
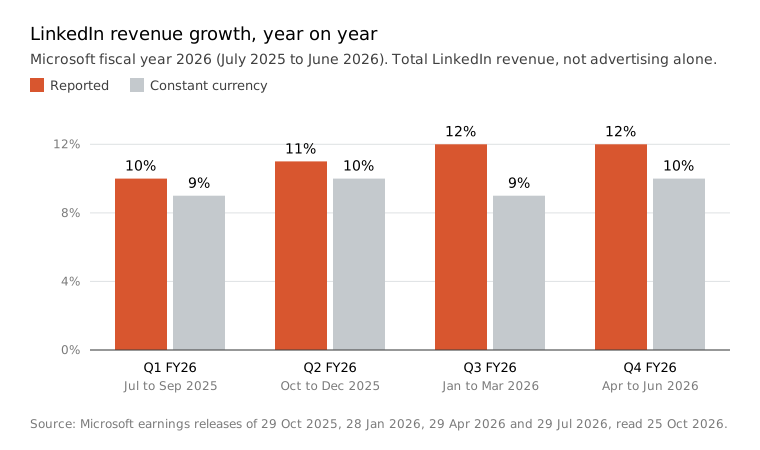
LinkedIn revenue grew 10% year on year (9% in constant currency) in the quarter to 30 September 2025, per Microsoft’s Q1 FY26 release; 11% (10%) in the quarter to 31 December 2025, per the Q2 release; 12% (9%) in the quarter to 31 March 2026, per the Q3 release; and 12% (10%) in the quarter to 30 June 2026, per the Q4 release dated 29 July 2026. All four were read 25 October 2026. The earnings releases give LinkedIn as a growth rate only, never a cash figure.
The advertising signal is in the commentary rather than the tables. On the Q4 FY26 earnings call, Microsoft’s chief financial officer said the 12% was “primarily driven by Marketing Solutions”, and guided to LinkedIn revenue growth “in the high-single digits” for the quarter to 30 September 2026. That is the company’s forecast, not a result, and this page is re-read when the result is published.
What Microsoft does not publish: LinkedIn ad revenue
There is no LinkedIn advertising revenue figure in Microsoft’s filings. The annual report names Marketing Solutions as one of LinkedIn’s businesses and reports them all as a single revenue line, so a page quoting “LinkedIn ad revenue” in dollars is quoting an estimate, usually without saying whose. We would rather leave the gap visible than fill it with a guess.
The nearest thing to an advertising figure from LinkedIn itself is on its pressroom page, read 25 October 2026: 26% year-over-year growth in paid video ads. The page does not say what is being counted (revenue, advertisers or impressions) or over which period, so treat it as LinkedIn’s claim about a direction of travel rather than a measurement you can set against anything else.
Members: registrations, not an audience
LinkedIn has “over 1.3 billion members” according to the shareholder letter in Microsoft’s 2026 annual report, dated 14 October 2026, which also claims five consecutive years of double-digit member growth. LinkedIn’s pressroom shows 1.3B+ members, while the About LinkedIn page still says more than 1 billion members in more than 200 countries and territories. All three were read on 25 October 2026, and two of them are LinkedIn’s own pages giving different headline numbers.
These are registered member accounts, not monthly active users, and none of these pages publishes an active-user figure. Quoting the member count as “LinkedIn’s audience” is the most common mistake in LinkedIn statistics posts, and the one a careful reader spots first. The audience that matters to an advertiser is the forecast Campaign Manager gives for your own targeting, not this headline.
Where the members are
The pressroom splits membership into four regions: Europe, the Middle East and Africa 430M+, Asia Pacific 410M+, North America 290M+ and South and Central America 226M+. The downloadable map beside it carries FY26Q2 in its file name, so the split probably dates from the quarter to 31 December 2025 rather than today. Derived by us: 430 plus 410 plus 290 plus 226 is 1,356 million, consistent with the 1.3B+ headline. The page gives no UK-only figure, so neither do we.
Benchmarks: Dreamdata’s 2026 customer panel
LinkedIn took 41% of total B2B ad budgets across Dreamdata’s customers, which Dreamdata describes as up 2% on the year without saying whether it means points or percent, according to Dreamdata’s 2026 LinkedIn Ads Benchmarks announcement, published 10 March 2026 and read 25 October 2026. The report is built on its customers’ aggregated data across 66M+ sessions and 3.5M+ customer journeys. Dreamdata sells B2B attribution software, not ad management, and lists a LinkedIn partnership in its own site navigation, so read this as a vendor’s panel of its own customers rather than a census of LinkedIn advertisers.
On cost, the same page gives an average LinkedIn cost per click of €5.98 against €1.60 on Meta, both in euros. Derived by us: €5.98 divided by €1.60 is 3.74, so a LinkedIn click cost about 3.7 times a Meta click in that panel. Dreamdata’s argument is that the click is the wrong unit: its cost per company influenced is €70.11 on LinkedIn, €128.70 on Meta and €110.37 on Google Search. Derived by us: €70.11 divided by €128.70 is 0.545, so LinkedIn’s cost per company influenced was 45.5% lower than Meta’s.
Search moved too. Dreamdata reports non-branded search falling from 37% of its customers’ budgets in 2024 to 33% in 2025, with cost per click on those terms up 29% and click-through rates down 26%. Those are Google figures inside a LinkedIn report, from a company whose product measures LinkedIn’s influence, so weigh them with that in mind and set them beside the platform’s own numbers on Google Ads Statistics 2026.
Return on ad spend, and what the percentage means
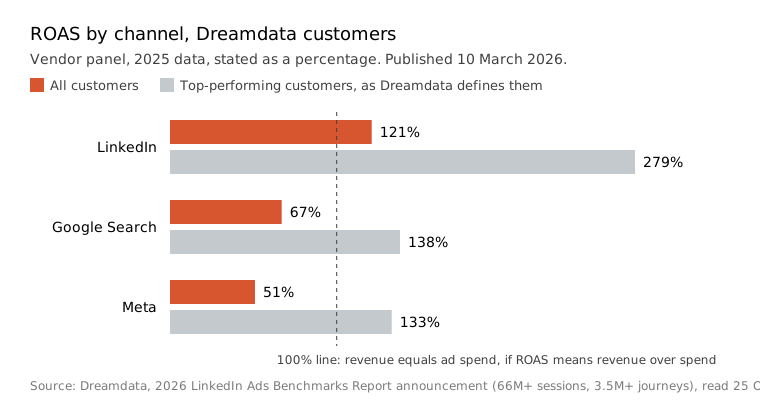
LinkedIn’s return on ad spend across Dreamdata customers was 121% in 2025, up from 113% in 2024, against 67% for Google Search and 51% for Meta, per Dreamdata’s announcement. For the customers it calls top performers, labelled by the 75th percentile, LinkedIn reached 279%, Google Search 138% and Meta 133%.
Read the unit carefully. The announcement states ROAS as a percentage and does not define it on the page. If it is revenue divided by ad spend, 121% means 1.21 units of attributed revenue for each unit spent, and 67% means Google Search returned less than it cost; we have seen the 121% restated elsewhere as $2.21 per $1, which only holds if it is a return on top of spend. The revenue is attributed through Dreamdata’s own model across long B2B journeys, which the same page puts at an average of 281 days from first ad impression to revenue. And ROAS is not ROI: neither figure subtracts margin or fees.
Budget floors in Campaign Manager
The minimum daily budget to start on LinkedIn is $10 USD for any ad format, and the minimum lifetime budget for a new, inactive campaign is $100 USD, adjusting once it launches to $10 multiplied by the days scheduled, according to LinkedIn’s own budget guide, read 25 October 2026. The page carries no date, so we date it to the day we read it.
The same guide says Campaign Manager suggests $25 USD a day for new advertisers and $50 to $100 USD for existing advertisers paying in dollars, with the equivalent of $25 in other currencies. Derived by us: $10 a day for a 30-day month is $300 USD, the smallest monthly budget a single always-on campaign can be given. A floor tells you what the platform will accept, not what buys enough clicks to learn anything at Dreamdata’s €5.98 average cost per click, and that sum is worth doing before you pick one.
Method
Every figure on this page was read off its own source on 25 October 2026 and linked where it appears. Seven figures are derived and show their working in place: LinkedIn’s fiscal 2026 and fiscal 2025 growth rates and the $2,005m increase from Microsoft’s 2026 annual report; the regional member total from LinkedIn’s pressroom; the click-cost ratio and the cost-per-company comparison from Dreamdata’s announcement; and the 30-day budget floor from LinkedIn’s budget guide.
Claims are labelled as claims. The member counts are LinkedIn’s and Microsoft’s own and count registrations. The paid video growth figure is LinkedIn’s, undated and undefined. Dreamdata’s benchmarks describe its own customers, in euros, with ROAS left undefined on the public page. Microsoft’s revenue figures come from its annual filing but cover every LinkedIn business, not advertising alone. Money stays in the currency its source used, with no conversion anywhere on the page.
This page is maintained: rolled every January, and re-read when Microsoft reports a quarter and when Dreamdata publishes its next annual report. It sits under the hub, Paid Advertising Statistics 2026.
What this means if you are running LinkedIn ads
A LinkedIn click is expensive, and on Dreamdata’s panel, which tracks revenue rather than leads, LinkedIn also came out top on return, which is why judging it on cost per click goes wrong (we made the same argument about Google in Stop Chasing Cheap Clicks). If you would like someone to look at your account, we run LinkedIn advertising for B2B and SaaS companies, and you can get in touch.
FAQ
Questions people ask
Why is there no UK LinkedIn member number on this page?
LinkedIn's pressroom publishes regional bands, and the UK sits inside Europe, the Middle East and Africa. We could not find a UK-only count on a LinkedIn or Microsoft page on the day we read them, so rather than repeat a figure from an aggregator we left it out. It goes in when a primary source publishes one.
Can I convert Dreamdata's euro figures into pounds or dollars?
You can do the arithmetic, but it will not turn them into a UK or US benchmark. They describe Dreamdata's own customers, priced in euros, and a converted figure is the same panel wearing a different currency sign. We leave every figure in the currency its source used.
Why does this page use Microsoft's fiscal year rather than the calendar year?
Because that is the period Microsoft's annual report uses. Microsoft's year runs from July to June, and its earnings releases give LinkedIn as a growth rate only, so a calendar-year LinkedIn revenue figure has to be assembled by someone from quarterly filings. Where you see one, check who added it up and from which quarters before you quote it.
Sources
- 1. Microsoft, 2026 Annual Report (Form ARS, including the fiscal 2026 Form 10-K and the shareholder letter of 14 October 2026) Read 2026-10-25
- 2. Microsoft, FY26 first quarter earnings release (29 October 2025) Read 2026-10-25
- 3. Microsoft, FY26 second quarter earnings release, Exhibit 99.1 (28 January 2026) Read 2026-10-25
- 4. Microsoft, FY26 third quarter earnings release, Exhibit 99.1 (29 April 2026) Read 2026-10-25
- 5. Microsoft, FY26 fourth quarter earnings release, Exhibit 99.1 (29 July 2026) Read 2026-10-25
- 6. Microsoft, FY26 fourth quarter earnings conference call (29 July 2026) Read 2026-10-25
- 7. LinkedIn Pressroom, About us: statistics Read 2026-10-25
- 8. About LinkedIn Read 2026-10-25
- 9. Dreamdata, Announcing the 2026 LinkedIn Ads Benchmarks Report (10 March 2026) Read 2026-10-25
- 10. LinkedIn Marketing Solutions, Making the most of your budget Read 2026-10-25
Cite this page
Free to quote with a link back. Figures were last checked on 25 October 2026.
Snowball Creations, "LinkedIn Ads Statistics 2026: Revenue, Members, Benchmarks", 2026. https://snowballcreations.com/research/linkedin-ads-statistics/
A plain-text version for AI tools and reference managers: /research/linkedin-ads-statistics.md